Holobiome: Research I Articles I Updates I News I Series I Feed
Holobiome is a blog series that offers an AI-assisted summary of the latest research articles on human microbiome.

The Microbiome Clock: How Timing Your Fat Intake Boosts Metabolic Health
This study reveals that not just what we eat but when we eat unsaturated fats can influence our metabolism by altering the gut microbial ecosystem. The researchers found that timing fat intake in relation to meals modulated the composition and activity of the gut microbiota, which in turn affected bile-acid metabolism and improved insulin sensitivity. In essence, the microbes in our gut act as metabolic gatekeepers, and their response to dietary fat depends on when fat enters the gut.
From a microbial perspective, this work underscores how gut bacteria respond dynamically to nutritional cues over time. By adjusting unsaturated fat intake to certain windows, the microbial community altered its processing of dietary lipids, which changed bile acid profiles compounds known to influence glucose metabolism and insulin action. The bile-acid changes likely reflect shifts in microbial species specialized in bile-acid transformation, although the paper stops short of naming exact taxa. Still, the mechanism illustrates a core theme in microbiome science: gut microbes are metabolic mediators that can amplify or mitigate the host’s responses to nutrients.
For readers curious about gut health, the findings reinforce the notion that dietary patterns and not only macro-nutrient composition can steer the microbiome toward beneficial activity. Strategic meal timing might thus offer a non-pharmacological way to leverage microbial metabolism for metabolic health. This study adds to growing evidence that the microbiome-diet interplay is dynamic and programmable, offering a new dimension to personalized nutrition via the “when and what” of eating.
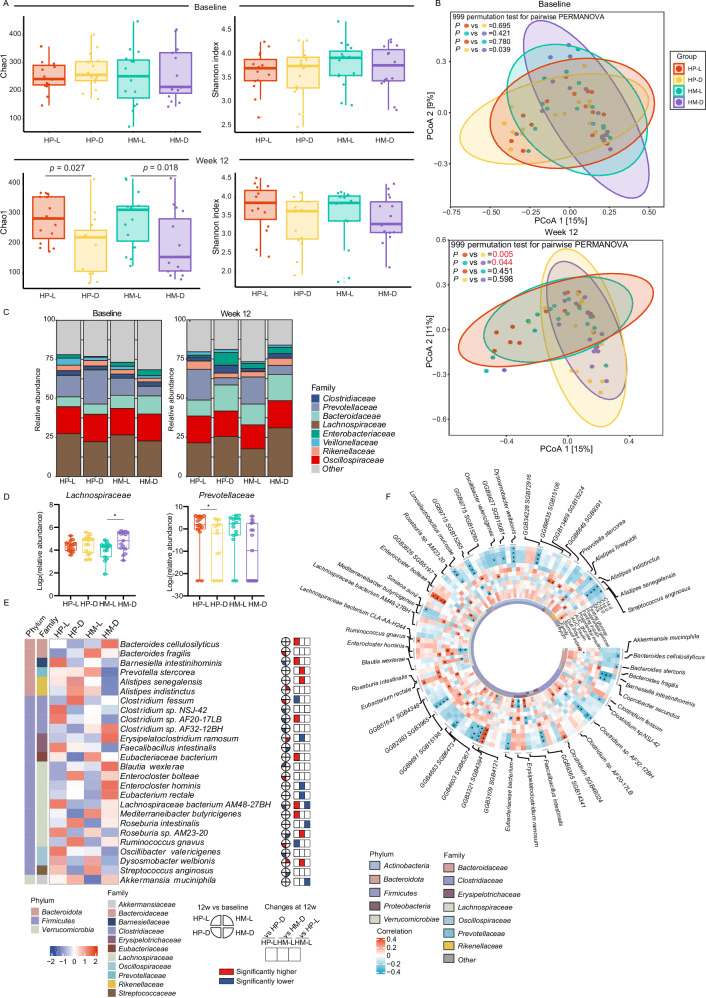
A Comparison of alpha diversity (Chao1 and Shannon indexes) at baseline and week 12 based on species levels. Data are shown as box-and whisker plots, centre line, box boundaries, lower whisker, upper whisker and light-colored circles represent the median, quartile, minimum range, maximum range and outliers respectively. Number of participants: n = 15 for each group. B PCoA based on bray-curtis dissimilarity showed different taxonomic compositions after 12-week intervention, and no significance was showed at baseline. P value was measured by PERMANOVA (two-sided) with 999 permutation tests, followed by Benjamini-Hochberg correction. P values were colored red if significant. C Barplots showed the percentage of the composition of fecal microbiome at the family level in each group. D Abundant of Prevotellaceae family and Lachnospiraceae family after the 12-week intervention (no difference at baseline). Data are shown as box-and whisker plots, centre line, box boundaries, lower and upper whisker represent the median, quartile, minimum and maximum range respectively. Analysis was done using MaAsLin2 (two-sided) followed by Benjamini-Hochberg correction.*P < 0.05. Number of participants: n = 15 for each group. E Abundance of significant species that were significantly correlated with clinical phenotypes. F Partial Spearman correlations of glucose- and lipid-related characteristics with significant species with baseline age, sex and body mass index adjusted. *P < 0.05. HP-L: high polyunsaturated fat diet at lunch; HP-D: high polyunsaturated fat diet at dinner; HM-L: high monounsaturated fat diet at lunch; HM-D: high monounsaturated fat diet at dinner. Source data are provided as a Source Data file.
Rebuilding the Gut After Transplant: Why the Right Microbiome Matters
When patients undergo allogeneic stem cell transplantation (alloHCT), their gut microbiomes often collapse, a dangerous dysbiosis associated with a high risk of acute graft-versus-host disease (aGVHD). This study tested whether restoring the gut microbiome early after transplant using a healthy donor’s stool (fecal microbiota transplantation, FMT) could help re-establish microbial diversity, repopulate beneficial commensals, and potentially protect against aGVHD.
In the initial “run-in” phase, 20 patients received FMT from one of three different donors. Detailed shotgun sequencing of stool before and after FMT revealed that microbial diversity severely depleted in patients rebounded substantially after FMT, with many commensal species engrafting successfully. Importantly, the degree of engraftment varied by donor: one donor (termed “Donor 3”) yielded a median engraftment rate of 66%, significantly higher than the other two donors.Compared with the poorly engrafting donor, patients receiving stool from Donor 3 had fewer severe aGVHD cases hinting that the specific mix of microbes delivered matters for clinical outcomes.
Looking more deeply into which microbes made a difference, the study found that Donor 3’s stool was particularly rich in beneficial genera such as Bifidobacterium adolescentis, Bifidobacterium bifidum, Dialister invisus, and Ruminococcus callidus. By contrast, another donor whose FMT correlated with worse clinical outcomes had different dominant species such as Ruminococcus bicirculans, Blautia wexlerae, Gemmiger formicilis, and Phocaeicola vulgatus.
In short, this work shows that FMT isn’t just a blunt re-seeding of an “average” microbiome the identity of the donor matters a lot, because different donors offer wildly different microbial ecosystems. Through careful donor selection and robust engraftment, FMT emerges as a promising, precision-guided strategy to rebuild a healthy microbiome after transplant — potentially preventing immunologically driven gut damage and lowering the risk of severe aGVHD.
a Genus-level microbiota composition, with the 15 most abundant genera among all samples shown. Less abundant genera are grouped together. The asterisks indicate samples from patients who received FMT. b Species-level donor microbiota heatmap visualizing the results of unsupervised hierarchical clustering using CLR-transformed abundances and a ward.D function. Each column is a sample and each row is a species. The blue-red gradient shows species abundances scaled row-wise. c Alpha diversity as measured by Shannon’s index. Each box shows the median (horizontal middle line) and interquartile range at the corresponding timepoint. Whisker lines indicate non-outlier maximum and minimum values. A small jitter is included for better visualization. The P value is from a Kruskal–Wallis test (P = 2.1 × 10⁸). Bonferroni-corrected P values in pairwise comparisons: P = 0.01 (donor vs. baseline), P = 0.003 (donor vs. pre-FMT), P = 0.04 (donor vs. post-FMT), 0.004 (baseline vs. pre-FMT), 0.0003 (baseline vs. post-FMT), and 2.1 × 10⁸ (pre-FMT vs. post-FMT). n = 3 (donor), n = 32 (baseline), n = 28 (pre-FMT), and n = 17 (post-FMT). d Species-level donor and patient microbiota heatmap. Methods and notations are similar to (b). Colored circles indicate post-FMT samples. e Differential abundance analysis using general linear model-based Microbiome Multivariable Association with Linear Models (MaAsLin2), comparing the two sample clusters in (d). Each circle in the volcano plot is a species; those with FDR-adjusted P value (q value) <0.05 are shown in red and those with a coefficient >2.5 or <−2.5 are labelled. The significance threshold is shown as a dashed blue line. Circles above this line represent statistically significant species. Species to the right/left of zero along the x axis were enriched in the cluster on the right/left of the heatmap in (d). f Beta diversity and ordination visualized by principal coordinate analysis. Aitchison’s distance was used to quantify the overall compositional difference between samples. The first two principal coordinates are shown. Numbers in parentheses indicate percent microbiota variation explained by the corresponding axis. Each symbol represents a sample. The centroid of each cluster is shown by a larger symbol. Confidence ellipses are shown. CLR centered log-ratio, FMT fecal microbiota transplantation, PC principal coordinate.
Feeding the Microbial Ecosystem: How a Multifunctional Diet Calms Gut Inflammation
This study explored how a two-month nutrition program — combining multiple bioactive dietary components — altered gut microbiota composition and inflammatory markers in people with cardiometabolic risk. What’s fascinating from a microbiome view is that the “diet formula” did more than influence human metabolic parameters: it reshaped the microbial community in the gut. After the intervention, participants showed a shift in gut microbiota composition, with increased abundance of microbial taxa often associated with healthy intestinal status, and a measurable reduction in intestinal inflammation.
Importantly, the dietary mix appeared to foster microbes that likely contribute to a healthier gut environment — though the paper emphasizes broad community-level changes rather than focusing on a single “hero species.” The modulation of the microbiota suggests that diet, when designed holistically, can nudge the microbial ecosystem from a pro-inflammatory state toward a more balanced, anti-inflammatory community. This in turn might reinforce gut barrier function, reduce low-grade inflammation often linked with metabolic disorders, and improve overall gut health.
For anyone curious about how food and microbes collaborate, these findings highlight a critical idea: what we eat — and how diverse the nutrients are — doesn’t just feed us, it feeds trillions of microbial residents that may, in turn, regulate our inflammation and metabolic well-being. Designing diets with microbial ecology in mind could become a cornerstone of future nutritional strategies, especially for individuals at risk of chronic metabolic or inflammatory diseases.
The Mouth–Body Connection: How the Oral Microbiome Differs in Fibromyalgia
This research takes a fresh look at how the oral microbiome differs in women with Fibromyalgia compared to healthy, age-matched controls. Even though overall species richness and diversity remained similar between the two groups, the composition of key bacterial players in saliva shifted — especially a rise in known periopathogens. Women with fibromyalgia showed significantly higher relative abundance of species like Prevotella denticola and Solobacterium moorei, both of which are often associated with poor oral health.
Interestingly, the study also connected these microbial shifts to self-reported measures of oral health: participants with fibromyalgia scored lower on oral-health metrics, and these poorer scores correlated with the altered microbial pattern. Meanwhile, several bacteria — including commensals such as Lactobacillus gasseri and Lactobacillus paragasseri — appeared underrepresented in the fibromyalgia group relative to controls.
These findings underscore a critical but often overlooked idea: the microbial communities of the mouth might reflect, or even influence, systemic health conditions beyond localized oral diseases. For fibromyalgia — a complex disorder with many poorly understood mechanisms — this altered oral microbiome hints at a potential “oral–systemic axis” worth exploring. While the study doesn’t demonstrate causation, it raises the intriguing possibility that microbial dysbiosis in the mouth could contribute to inflammation or immune signaling in ways that matter for fibromyalgia symptoms.
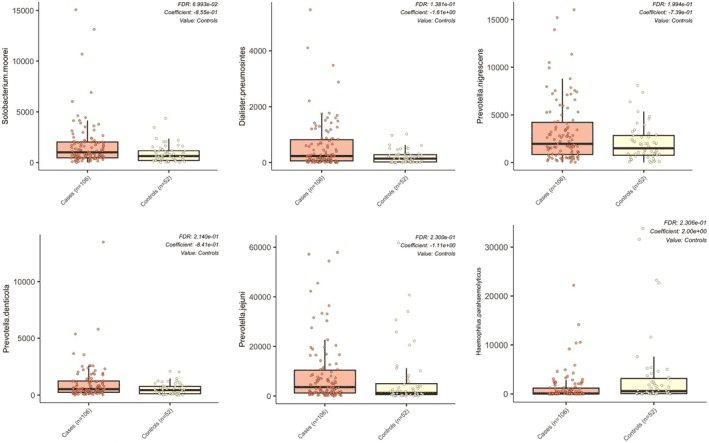
Differences in relative abundance of oral microbial species between women with fibromyalgia and controls.