- Feb. 4, 2019
- Shivangi
- On Diversity Debate
BugSpeaks through Cladogram
Charles Darwin, with this famous entry in his journal, begins with "I think" on the top left-hand corner of his notebook and then sketched out the first “tree of life”, which was his perception of how all living things on earth are connected through evolutionary history. Through this he proposed the theory of "the origin of species through natural selection" and divergence of all species from an ancestral population.
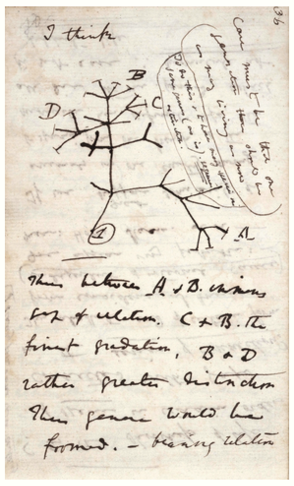
In short, he meant we all are related!!
That doesn't mean only us humans. But every living being on earth can trace its descendance back to a common ancestor.
To understand this, let's begin with basic taxonomic classification, which we all studied during our biology 101 classes. By definition, “Taxonomy is the science of defining and naming groups of biological organisms based on shared characteristics.” Organisms are grouped together into groups termed as ‘taxa’, and these groups are given a taxonomic rank, which looks something like this
Kingdom => Phylum => Class => Order => Family => Genus => Species
Now, when you want to show these relationships among organisms in a simplified way, the phylogenetic tree comes into picture, through which relationships are illustrated by a phylogenetic tree/dendrogram.
Phylogenetic trees
represent hypotheses about the evolutionary relationships (the descendance) among a group of organisms, originating from a common ancestor and can be built using morphological (body shape), biochemical, behavioural, or molecular characteristics of species or other groups. Dendrograms are often used to illustrate such evolutionary relationships, along with information like evolutionary time line separating the taxa (like, how many million year ago did this species come into being), genetic distance (between the gene sequences being classified), and so on.
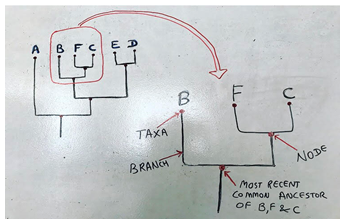
A cladogram (from Greek, clados "branch" and gramma "drawing") is a type of phylogenetic tree that only shows tree topology. Basically, a cladogram uses lines that branch off in different directions, representing a group of organisms with a last common ancestor, ending at a clade. The branching pattern is called the tree’s topology.
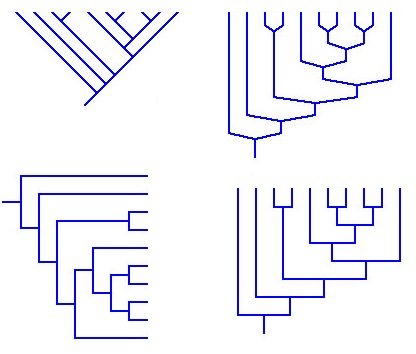
There are many shapes and forms of cladograms, through which the phylogenies are represented, but they all have lines that branch off from other, and the lines can be traced back to where they branched off.
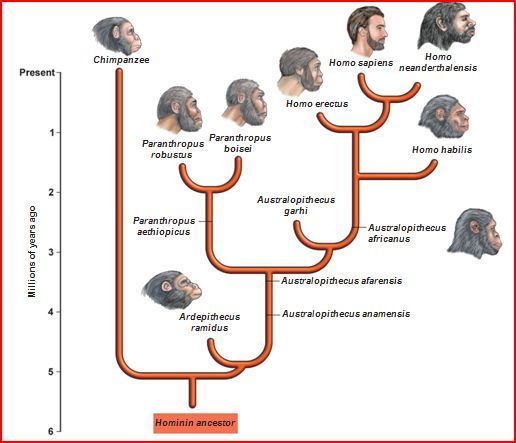
By topology, it also means showing only the basic relationships between the taxa, without any additional details. For example, say we want to represent human evolution through a cladogram, then we represent chimpanzees to be more closely related to us than gorillas. But this is represented just as a tree, without the time line (unlike the pictorial representation besides).
Now let's take a closer look at the cladogram, where we will zoom-in on one clade within the cladogram. Always, the species (taxa) are found at the tips (represented by B, F and C), extended by lines referred to as the tree's “branches”. The pattern in which the branches connect represents our understanding of how the species in the tree evolved from a series of common ancestors. Each node represents a divergence event or splitting of one group into two descendant groups.
Take a look at this amazing candy bars phylogeny that shows the relatedness between candy bars represented as a cladogram. This draws an accurate analogy to understand the basic evolutionary relatedness of species (and has the added advantage of candy bars being easily accessible (unlike animals) and easy to understand the phylogenetic tree structure even by a layman).
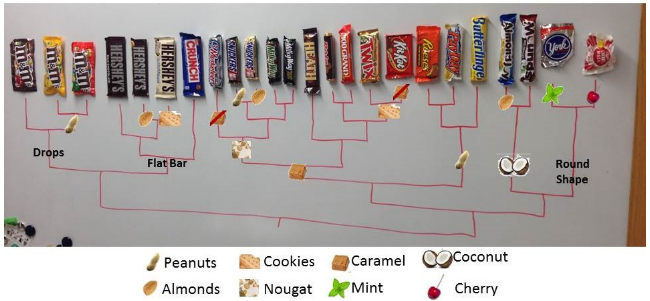
These candy bars are related to each other based on their content and shape. In a similar way species can also be compared and represented based on their genetic content (DNA/RNA) and their morphological characteristics. If we dig deep, the peanut clade has three candy bars or taxas (representative of species) with peanut as its common ingredient (representative of common ancestor). With such analogies we can understand how phylogenies are connected and important to understand the evolutionary insights.
Cladograms and Microbiota
Mainly phylogenies are used to represent species evolution, as in of higher organisms like humans, fishes and tress and so on. But there are also other applications like, plotting microbial taxonomic compositions of metagenomic data, which is the base of our BugSpeaks® analysis. In the specific context of microbial genomics and metagenomics, next-generation sequencing data, of say gut microbiome, produces datasets of unprecedented size and tremendous genetic diversity of microorganisms. And cladogram seems to be the simplest way of displaying these diverse phylogenies with thousands of microbial taxa within the sample.
Since cladograms are simple topology-based representations, they are simpler to understand by the end users and does not complicate the data with too much scientific information. However, we have also made specific modifications to these representations, to not just represent microbial composition, but also to display it’s metadata like species abundances, host or environmental phenotypes etc. With the end user in mind, just this simple cladogram can present the overall microbial diversity and other relevant information, yet also provide specific scientific data (like alpha diversity) of the sample, if the same representation is viewed by a researcher or a clinician with microbiome background.
Let’s try to read one such annotated cladogram representing microbial composition of a human gut sample.
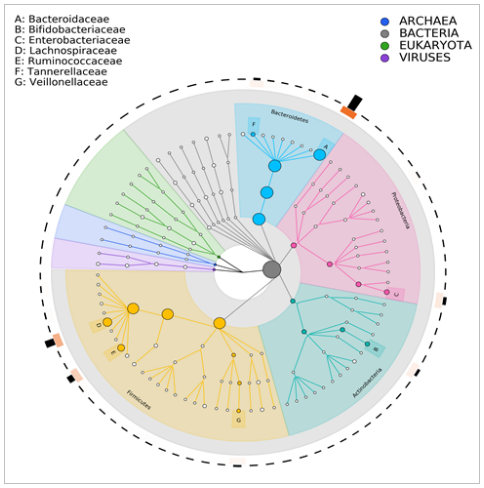
This is a circular cladogram with basic visualization of the tree’s hierarchical structure. It has all the same representations as nodes, branches and taxas that were discussed above. It has four major clades (kingdoms) starting from centre, including Archaea, Bacteria, Eukaryota and Viruses presented in four different colours. Each has branches which represents next levels (Linnaean ranks), including Phylum, Class, Order, Family, Genus and finally the tip representing species (this cladogram image shows family level phylogeny). The size of circles at nodes and tips represents the abundance of rank and outer ring represents the species abundance in the form of bar plot (grey bars on the outermost circle). Highly abundant taxas are annotated as legends at top left corner.
By providing such a cladogram, we give the overall picture of an individual’s microbial diversity in his/her gut. Supplementing this with other plots and graphs, we provide a thorough summary of one’s BugSpeaks® profile, all represented through pictures.
Coming a full circle, what Darwin sketched as the simplest idea of tree of life, is still relevant and applicable even after a century, which is only a testament to his genius.